Using Monitoring to Debug Network Connectivity
You can use Contrail's analytics nodes to collect system state information, usage statistics, and debug information from all of the software modules across all of the nodes of the system. Debug information collected by the analytics nodes includes the following types:
- System log (syslog) messages—informational and debug messages generated by system software components.
- Object log messages—records of changes made to system objects such as virtual machines, virtual networks, service instances, virtual routers, BGP peers, and routing instances.
- Trace messages—records of activities collected locally by software components and sent to analytics nodes only on demand.
Using the Monitor > Networking > Networks page, you can click on the name of any of the listed networks to get details about the network connectivity, traffic statistics, port distribution, and routing instances.
You can customize the provided demo setup in Contrail to monitor your particular networking environment and check for connectivity between two virtual routers (vRouters).
- Navigate to the first routing instance you want to monitor:
Monitor > Networking > Networks > default-domain:demo:vn0, Instance ed6abd16-250e-4ec5-a382-5cbc458fb0ca with IP address 192.168.0.252 in the virtual network vn0.

- Click the instance to view its traffic statistics.
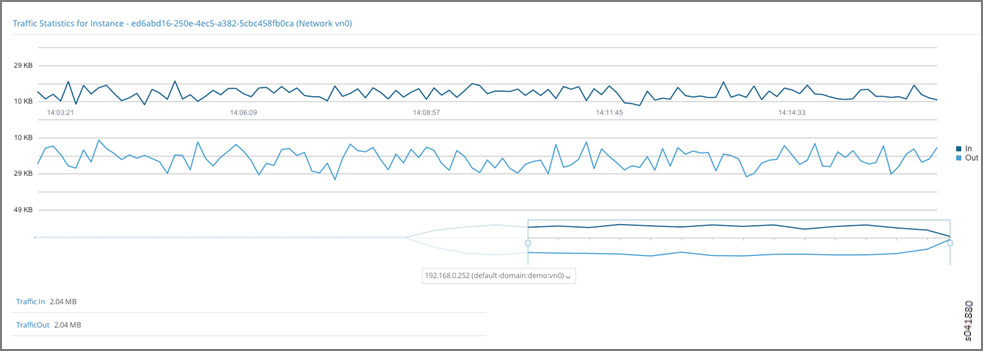
- Navigate to the second routing instance to monitor:
Instance d26c0b31-c795-400e-b8be-4d3e6de77dcf with IP address 192.168.0.253 in the virtual network vn16.

- Click the instance to view its traffic statistics.
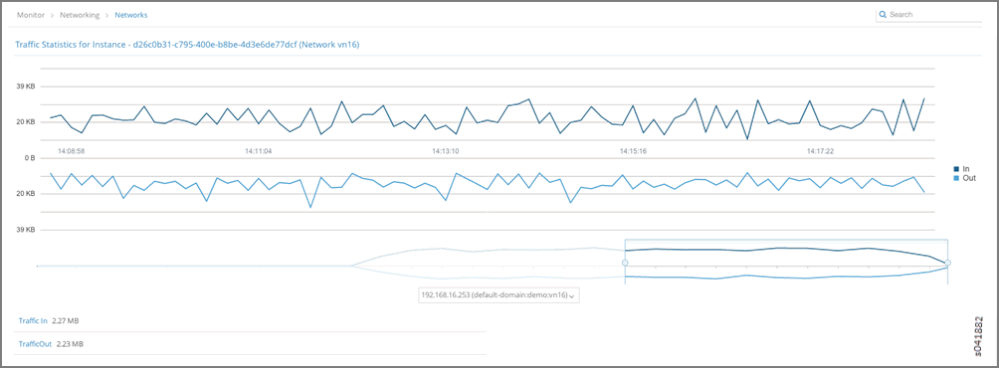
- From Monitor > Infrastructure > Virtual Routers > a3s18 > Interfaces, navigate to virtual router (vRouter) a3s18 to view its interfaces. You can see that Instance ed6abd16-250e-4ec5-a382-5cbc458fb0ca is hosted on vRouter a3s18.

- From Monitor > Infrastructure > Virtual Routers > a3s19 > Interfaces, navigate to virtual router (vRouter) a3s19 to view its interfaces. You can see that Instance d26c0b31-c795-400e-b8be-4d3e6de77dcf is hosted on vRouter a3s19.

- vRouters a3s18 and a3s19 both contain access control list (ACL) entries associated with individual routers that allow connectivity between the default-domain:demo:vn0 and default-domain:demo:vn16 networks.
ACL Connectivity a3s18

ACL Connectivity a3s19

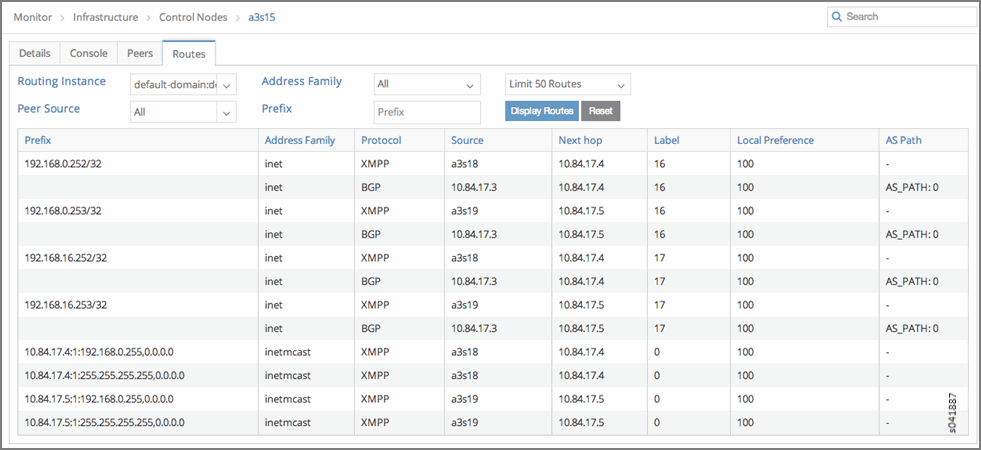
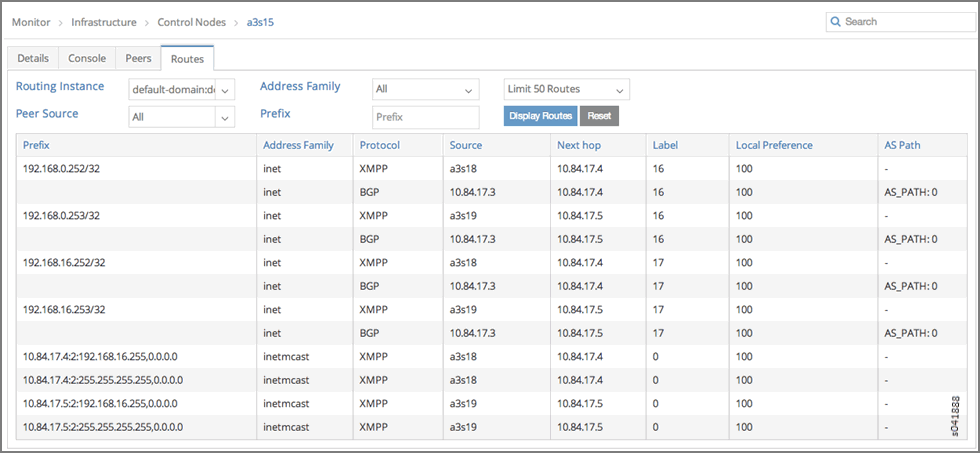
- After verifying the connectivity between the networks, verify the routes on the control node for routing instances default-domain:demo:vn0:vn0 and default-domain:demo:vn16:vn16.
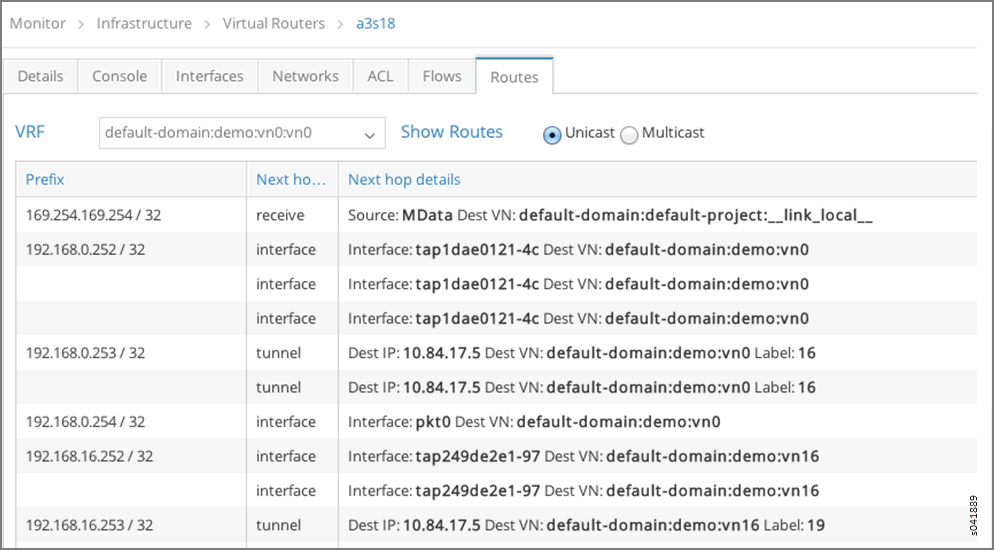
Routes default-domain:demo:vn0:vn0
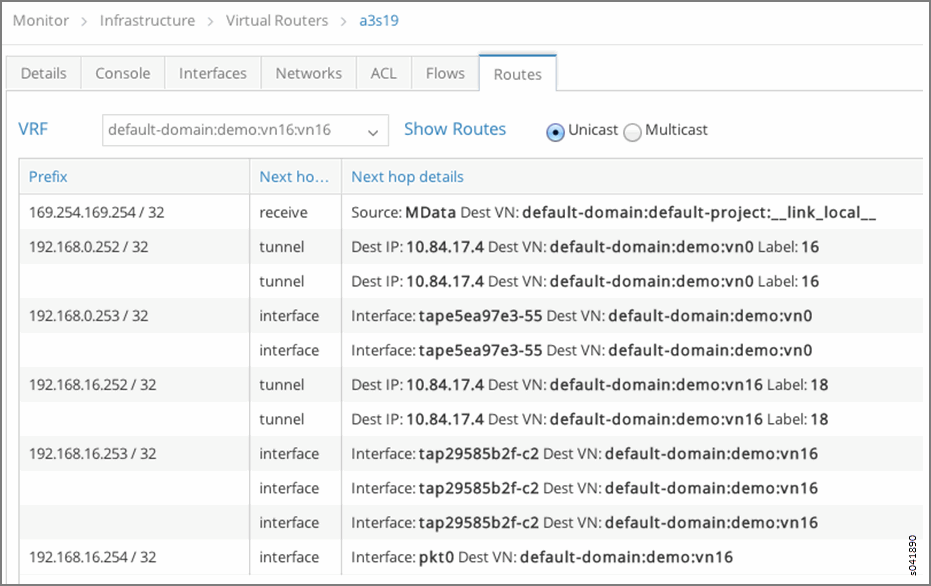
Routes default-domain:demo:vn16:vn16
- You can see that virtual routing and forwarding (VRF) default-domain:demo:vn0:vn0 on vRouter a3s18 has the appropriate route and next hop to reach VRF default-domain:demo:front-end on vRouter a3s19.
- You can see that VRF default-domain:demo:vn16:vn16 on vRouter a3s19 has the appropriate route and next hop to reach VRF default-domain:demo:vn0:vn0 on vRouter a3s18.
- Finally, you can verify flows between instances (IPs 192.168.0.252 and 192.168.16.253) on vRouters a3s18 and a3s19.
Flows for a3s18

Flows for a3s19
